Estimation of the Number of Cumulative COVID-19 Cases by Day in Thailand Based on a Flattened Curve Policy
DOI:
https://doi.org/10.48048/wjst.2021.10054Keywords:
Coronavirus disease 2019, Estimating derivative, Exponential growth curve, Least square method, Logistic growth curveAbstract
Since December 2019, the world has been facing an emerging infectious disease named coronavirus disease 2019. Thailand has also been affected by the spread of the coronavirus. The Thai government have announced policies to protect people, based on the emergency decree and curfew law for flattening the curve of the number of the coronavirus disease 2019 cases without vaccination in Thailand. This research estimated of the number of total infectious cases of coronavirus disease 2019 in Thailand. Two growth curves, including an exponential growth curve under a non-flattened curve policy (herd immunity policy without vaccination), and a logistic growth curve under a flattened curve policy without vaccination, were selected to estimate the parameters of the curves by the least square method to represent the number of the total infectious cases in Thailand. Moreover, the maximum infectious cases of coronavirus disease 2019 and the speed of spreading for coronavirus disease 2019 in Thailand were also explored. Based on the number of the total infectious cases of coronavirus disease 2019 in Thailand, the findings demonstrated that the coefficient of determination of the logistic growth curve was greater than the exponential growth curve and the root means squared percentage error of the logistic growth curve was less than the exponential growth curve. These results suggest that the logistic growth curve is suitable for describing the number of total infectious cases of coronavirus disease 2019 in Thailand under the fattened curve policy.
GRAPHICAL ABSTRACT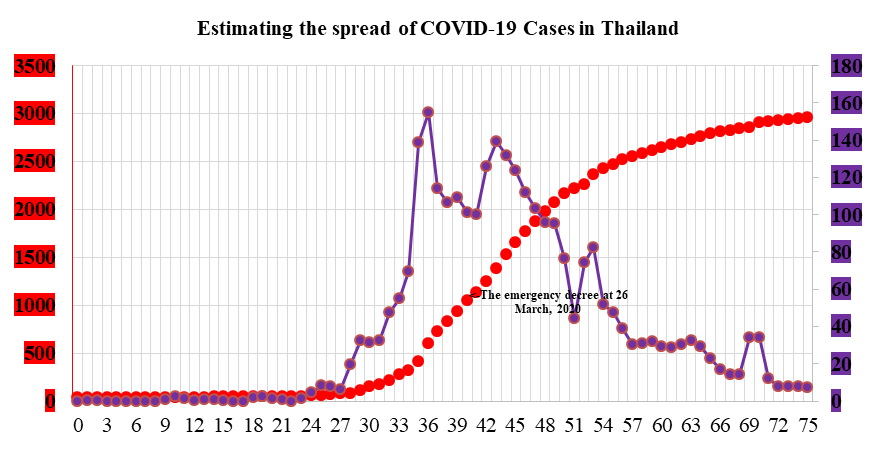
Downloads
References
SB Snider and JN Brimlow. An introduction to population growth. Nat. Educ. Knowl. 2013; 4, 3.
S Nikolai, B Bogdan, S David, A Edoardo and V Alexander. Constant growth rate can be
supported by decreasing energy flux and increasing aerobic glycolysis. Cell Rep. 2014; 7, 705-14.
J Allen and B Waclaw. Bacterial growth: A statistical physicist’s guide. Rep. Prog Phys. 2019; 82, 1-55.
MD Rolfe, CJ Rice, S Lucchini, C Pin, A Thompson, ADS Cameron, M Alston, MF Stringer, RP Betts, J Baranyi, MW Peck and JCD Hinton. Lag phase is a distinct growth phase that prepares bacteria for exponential growth and involves transient metal accumulation. J. Bacteriol. 2012; 194, 686-701.
P Mariappan. Business mathematics, Pearson India Education Service, Delhi, 2015.
TB Robertson. On the normal rate of growth of an individual and its biochemical significance. Archiv für Entwicklungsmechanik der Organismen. 1908; 25, 581-14.
J France, J Dijkstra and MS Dhanoa. Growth functions and their application in animal science. Anim. Res. 1996; 45, 165-74.
F Rashad and AS Firas. Growth curve of commercial broiler as predicted by different nonlinear functions. Am. J. Appl. Sci. Res. 2015; 1, 6-9.
A Moharrery and M Mirzaei. Growth characteristics of commercial broiler and native chickens as predicted by different growth functions. J. Anim. Feed Sci. 2014; 23, 82-9.
J Vandermeer. How populations grow: The exponential and logistic equations. Nat. Educ. Knowl. 2010; 3, 15.
JW Cain. Mathematics of fitting scientific data. In: RD Wells, JS Bond, J Klinman and BSS Masters (Eds.). Molecular Life Sciences. Springer Science+Business Media, New York, 2014, p. 668-73.
A Kharab and RB Guenther. An introduction to numerical methods A MATLAB approach. CRC Press, Florida, 2012.
D Jukić and R Scitovski. Solution of the least-squares problem for logistic function. J. Comput. Appl. Math. 2003; 156, 159-77.
MS UllaH, G Mostafa, N Jahan and MAH Khan. Analyzing and projection of future Bangladesh population using logistic growth model. Int. J. Mod. Nonlinear Theor. Appl. 2019; 8, 53-61.
J Dragan, K Gordana and S Rudolf. Least-squares fitting Gompertz curve. J. Comput. Appl. Math. 2004; 169, 359-75.
R Sunthornwat and Y Areepong. Predictive model for the total daily COVID-19 cases with herd immunity policy. Chiang Mai Univ. J. Nat. Sci. 2021; 20, e2021016.
Worldometer, Available at: https://www.worldometers.info/coronavirus/country/thailand, accessed April 2020.
PF Verhulst. Notice sur la loi que la population suit dans son accroissement. Correspondence Mathematique et Physique (Ghent). 1838; 10, 113-21.

Downloads
Published
How to Cite
Issue
Section
License
Copyright (c) 2021 Walailak University

This work is licensed under a Creative Commons Attribution-NonCommercial-NoDerivatives 4.0 International License.